visualization
Something to Bragg about!
Yes, the extra “g” was intentional. You see, 2014 is the International Year of Crystallography declared by the United Nations. So, Crystallographers are “Bragg”ing about it! [You see what I did there? 🙂 ]
In this month’s issue (February 2014) of Biophysical Journal, the biophysicist couple Prof. Jane RIchardson and David Richardson came out with an article that commemorates this special year. The number 54 gains value here.
- In this issue they highlight 54 protein structures that basically, as they put it, “illuminated” the field of biophysics.
- The number 54 also denotes the number of years since the structure of myoglobin was solved.
- Additionally, If you wanted a year long celebration, you need at least one structure solved by X-ray crystallography per week. So, you can look at one molecular structure at a time and marvel at it. (As a bonus, you get two more.)
As I read the article, I was squeeing with delight, as it had hand drawn pictures of the earliest solved structures! Those pictures definitely upped the oomph factor for these proteins. The best part is this article is open access. So, I can make a slideshow of these structures! Lo and Behold!
If you want to add some unique information about any of these proteins, look out for the list to be available in WIkipedia. http://en.wikipedia.org/wiki/Wikipedia:WikiProject_Biophysics#New_articles
Wait, that’s NOT all. If you go to IYCR2014 website, there is tons of information there. For example, if you go to events, you can look at the year long celebrations happening around the world.
If you point your browser to http://www.iycr2014.org/learn/educational-materials you will find a good list of things about crystallography one can learn about!
References:
- http://www.iycr2014.org/
- Jane S. Richardson and David C. Richardson (2014). Biophysical Highlights from 54 Years of Macromolecular Crystallography Biophysical Journal, 106 (3), 510-525 DOI: 10.1016/j.bpj.2014.01.001
P212121 – The most frequently seen space group in protein crystals
It is a fact that there is a non-uniformity with which different space groups occur in protein crystals. For example, the space group P212121 is the most frequent in protein crsytals and occurs almost one-third of the time!!!
Why is this so? This was the question asked by Wukovitz and Yeates in their paper titled “Why protein crystals favour some space-groups over others” [1]
![]()
Comparing the protein crystals with organic molecule crystals it seems there are marked differences. The rules for organic molecules’ molecular packing was proposed by Kitaigorodskii and it became widely accepted. [2]
However, If we look at the distribution of the space groups in organic molecules and proteins there are marked differences. Thus, the authors argue that same criteria cannot be applied to proteins. One major difference between the crystals is that protein crystals contain 50% solvent by volume, while organic crystals are jam-packed with less space. This results in a higher “coordination number” (10-14) for organic crystals than for proteins, where the number is average 7.5
Based on all these, the authors tried to devise a simple statistical measurement that can answer as to why certain space groups are preferred among the 65 biological space groups.
And the formula is:
D=S+L-C, where
D = Total number of rigid-body freedom
S = number of meaningful degrees of freedom
L = number of independent parameters for describing the unit cell, and
C = minimum number of unique contacts required to make the set of symmetry related molecules
All three are positive integers and are not adjustable parameters. The explanation given by a simple statistical analysis for protein crystals is “For a particular space group only a certain number of rigid-body degrees of freedom are available for assembling the first few molecules before the internal structure of the crystal is completely defined. This number depends on the space group symmetry.”
Three things limit the rigid-body degrees of freedom
- number of meaningful Rigid-body DOF for the first molecule in space
- the number of independent unit-cell parameters
- the number of intermolecular contacts to make a network
How to find C?
The problem of finding C is equivalent to the problem of identifying the minimal set of symmetry elements. For each space group, C can be determined by finding the minimal set of generators for each space group. The numbers range from 5 to 2.
The authors observed that the calculated value of D correlated with the observed frequency of the space group!That is, higher the value of D the most frequent space group. Guess which space group had a higher D value?
Now the question comes back to “Why P212121 is more frequent?” The reason is that this space group is the least restrictive for the possible orientations and positions of the molecules in the crystal.
The authors do note that their analysis does not take into consideration of the shape of the molecule, energetics, and packing efficiency, which can lead to answers for non-monomeric proteins in the asymmetric unit. According to the authors, P1 has a D value of 8, and is predicted to be the most used space group for racemic protein mixtures.
References:
- Wukovitz SW, & Yeates TO (1995). Why protein crystals favour some space-groups over others. Nature structural biology, 2 (12), 1062-7 PMID: 8846217
- Kitaigorodskii AI. Organic Chemical Crystallogrphy (1955) Consultants Bureau, New York (Originally published in Russian by Press of the Academy of Sciences of the USSR, Moscow)
Molecular visualization tools – Survey and practical tips
What would be like to teach a class or describe someone about a protein, without visualizing its structure? Boring is one word that pops in my mind. I vividly remember the professor drawing two blobs touching each other, to describe protein-protein interaction, while explaining it either on the blackboard or on the transparencies of a over-head projector. Those were the days! Tracing back nearly 60 years back, when John Kendrew showed everyone a coiled mess, it has fueled every scientist’s imagination to visualize a protein. The coiled mess is aptly titled “Turd of the century”!
If you are in UK, Click here to see the exhibit of myoglobin, and the accompanying Guardian article. If John Kendrew had the plethora of visualization choices like we have today, what could have happened?
Coming to today, it is become so routine to use a molecular visualization tool to check-out a protein. And most journals contain the Jmol plugin while browsing the full text of any article, if they discuss any structures from the PDB. So, when a survey was recently conducted by Craig P. A. et al to estimate the effectiveness of these tools, certain things were obvious.
- Molecular visualization software/tools is akin to Oxygen for researchers and most importantly, for educators.
- They make it fun to understand the complex biology behind every structure
It makes sense to survey only about freeware since
neither student nor faculty are usually willing (or able) to pay for commercial molecular visualization software when freeware applications are available
![]() 10 years ago, I used to use Chime very frequently and now Jmol has replaced it as the web plugin. (Whatever happened to Chime?) The majority of people who participated in the survey were associate professors, using Windows and have been using the various tools for the past 5-10 years. The biggest use was for teaching biochemistry classes. It is no surprise that PyMOL came across as the most frequently used software. However, the supported version being commercially sold by Schrodinger, many participants from small undergrad institutions have voiced their dissatisfaction about it. Since, the educational version is a pain.
10 years ago, I used to use Chime very frequently and now Jmol has replaced it as the web plugin. (Whatever happened to Chime?) The majority of people who participated in the survey were associate professors, using Windows and have been using the various tools for the past 5-10 years. The biggest use was for teaching biochemistry classes. It is no surprise that PyMOL came across as the most frequently used software. However, the supported version being commercially sold by Schrodinger, many participants from small undergrad institutions have voiced their dissatisfaction about it. Since, the educational version is a pain.
The survey posted some interesting open-ended questions:
- What additional resources would you like to have available to teach molecular structures?
- What would you like to be able to do with 3D molecular visualization programs that you currently cannot do?
For the second, question many wanted “a simple way to create animations/morphs between structures”. The authors noted that while there are resources available inherently with the tool the participants were using. There was a clear lack of awareness of the full-potential of the software they were using. Readers of this blog would remember the previous post of making animated gifs of proteins (Yes, it is pronounced as Jif!). Also, the Yale Morph Server does a good job of showing conformational change in a protein.
To tackle this issue, some universities have a one-semester course for graduate students and postdocs, where they teach how to use visualization tools and also how to best present a molecular structures. But, for others who don’t have such courses scroll down to the end to see some practical solutions.
How does the future look like?
From the survey, it looked like four areas needed more concentration
- Assessment – How to know exactly if the student understood the background of the protein? In other words, some type of rubric to follow. Rubrics might be easier for assessing undergrad classes in an uniform way, but make it complex for assessing the graduate student who is working on a narrow-down topic
- Support – Need for tutorials for users at different levels
- Attitude – That is there exists a kind of wall between the student and the computer.
- Software – Can ONE software do everything that VMD, Chimera, and PyMOL put together? I really like that idea!
Among the wishlist the participants asked was to have the tool efficiently demonstrate dynamics, motions, protein-ligand interactions. To some extent, depending on which tool one is using, these are implemented as plugins or modules. This brings us back to the topic of creating awareness about the tool in use.
How to create your own custom tutorial to learn a new molecular visualization tool?
So, you have come across a new freeware, mentioned by your colleague or read somewhere, and want to use it. Some tips that would be useful are as follows:
- If you don’t have permissions to install, of course you need to get your administrator to install it. There is always the alternative of installing it in your laptop. If you are really apprehensive about the tool, create a guest account (with no administrative permissions) and install it in the desktop area.
- Almost all tools come with tutorials as to how to take the baby-steps of learning the tool. If you don’t like it, download a PDB file from this link. It has PDB entries with “Only Protein with Ligand”
- As a kid if you have broken down a new toy to its nuts and bolts and recreated it back to factory settings, then this step is easier. Basically, try every option one after another. This might take time and can be somewhat frustrating. But, there are “Aah” moments while doing it and the time invested now is greatly rewarding when you have to figure out with your protein of interest.
- Google “The tool in use” and search in images, you will see a plethora of images made by others which can be taken as a small assignment to take up. Don’t worry about completing it to the end. The objective is to getting to know the software/tool rather than getting good results
- If you like the tool, try recreating something interesting that you had done with another tool. Compare and contrast. Now, you know something that others don’t!
References:
- Craig, P., Michel, L., & Bateman, R. (2013). A survey of educational uses of molecular visualization freeware Biochemistry and Molecular Biology Education, 41 (3), 193-205 DOI: 10.1002/bmb.20693
- http://www.guardian.co.uk/science/occams-corner/2013/apr/19/1
- http://www.sciencemuseum.org.uk/visitmuseum/galleries/crystallography.aspx
- http://molmovdb.mbb.yale.edu/molmovdb/morph/
Dance! Dance! Dance!
It is refreshing to see, literally, someone dancing as a protein! And when it is choreographed well, it becomes a awesome video to show in your class.
Recently, Biophysical Society had launched the “Biophysics—The Everyday” video contest “that explained how biophysics affected everyday life”. The following video, explaining protein folding, was picked as a winner. Congrats to the winner!
Seeing the protein folding dance, I remembered this vintage Protein synthesis dance, I had seen long time back. Enjoy your Friday!
David Goodsell like images
Almost all of us visiting PDB would have looked at the image shown below that attract us like moths attracted to a light. I am talking about the aesthetically pleasing protein images created by David Goodsell.

p53 Tumor Suppresor.
Image Courtesy: http://dx.doi.org/10.2210/rcsb_pdb/mom_2002_7
In case you didn’t know, he is the author of Molecule of the Month series. Since the images look anything like the ones we usually keep looking at, one is attracted to the level of abstraction the image projects due to which, the reader understands the big picture. And, of course, they come in all cute colors!
To quote him about the artwork’s intention, that is to give
a pictorial overview of the molecules that orchestrate the process of life. [2]
Some history about David Goodsell can be found in his website and here.
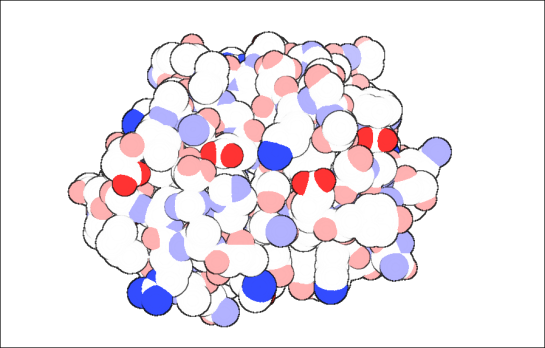
So, you have correctly guessed that this post is about how to make such “David Goodsell-sque” images of your protein. For consistency, I used 2BEM, a CBM33 polysaccharide monooxygenase enzyme [3]. The view is looking at the protein’s active site, which is quite planar.
Using Python Molecule Viewer
PMV [4] is good tool to run AutoDock, and manipulating structures. This link explains in basically two steps of getting such images. Here is my try with PMV
Using PyMOL
Can PyMOL be far behind in implementing this? I didn’t think so. Fortunately, there are at least two alternate ways of doing this in PyMOL.
1. Using a couple of commands. After loading the protein, type in the following commands as given here [5]
- unset specular
- set ray_trace_gain, 0
- set ray_trace_mode, 3
- bg_color white
- set ray_trace_color, black
- unset depth_cue
- ray
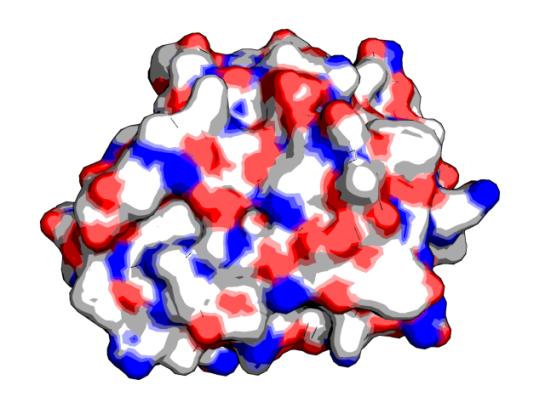
In surface,
If you want to change the colors to David Goodsell-sque, then it comes out like this. The important commands are the “specular” and “ray_trace_mode, 3”.
2. Are you thinking “Meh!, Close enough. But, not what I was looking for.”? Then, with some small tweaking in PyMOL you could get like this, using GLSL shaders [6, 7]
If you are using VMD version 1.8.7 or 1.8.6, then you can follow this link [8]
After loading the molecule, this is what I did to get the following image
- Main Menu->Graphics-> Representations
- Coloring method->Element
- Drawing Method->VDW
- Material->Goodsell
- Main Menu->Display->Rendermode->GLSL
- Main Menu->Display->Light 3
- Main Menu->Graphics-Materials->Goodsell->I played around with the diff parameters given under that
- Main Menu->Graphics->Colors->Categories->Element->C->white
- Main Menu->Display->Axes->Off
Using VMD and Blender
In case, you need to make such images to make a great impression, you can learn how to use Blender. It is a open-source 3D tool that can create models and has huge applications in animated movies, interior designing and other non-science stuff. See this link for more details: http://chemistry.stackexchange.com/questions/484/what-software-is-used-to-generate-the-pdb-molecule-of-the-month-images
I did not use VMD or Blender for 2BEM so using one of the images given in the above link. [9]
Using QuteMol
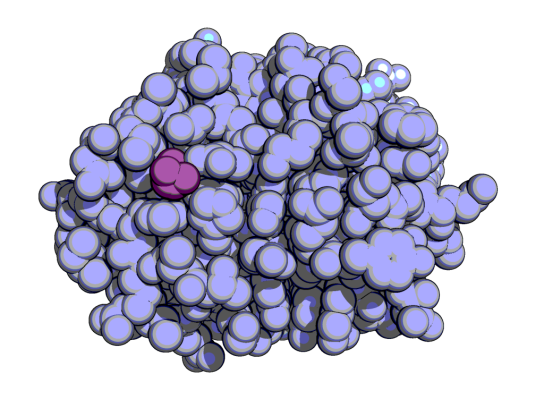
This is probably the ONE-CLICK David-Goodsell-sque image making tool. Download it from here. After loading the molecule, just click on the “Molecule of the Month” button. Voila!
A downside was I was unable to change the carbons to white. Sigh!
Anyway, I hope you had fun making images like I did. Enjoy! 🙂
References:
- http://mgl.scripps.edu/people/goodsell/
- http://www.asbmb.org/asbmbtoday/asbmbtoday_article.aspx?id=13702&page_id=2
- http://dx.doi.org/10.1074/jbc.M407175200
- Sanner MF (1999). Python: a programming language for software integration and development. Journal of molecular graphics & modelling, 17 (1), 57-61 PMID: 10660911
- http://www.pymolwiki.org/index.php/Gallery
- http://pymolwiki.org/index.php/GLSL_Shaders
- http://kpwu.wordpress.com/2012/06/28/pymol-draw-goodsell-like-view-using-glsl/
- http://www.ks.uiuc.edu/Research/vmd/minitutorials/glsloutline/
- http://chemistry.stackexchange.com/questions/484/what-software-is-used-to-generate-the-pdb-molecule-of-the-month-images
- http://pmvbase.blogspot.com/2010/04/making-david-goodsell-like.html
- http://www.researchgate.net/post/How_can_I_draw_proteins_like_in_PDB_Molecules_of_the_Month
- http://biostumblematic.wordpress.com/2009/12/02/rendering-proteins-in-pymol/
- Sanner MF, Olson AJ, & Spehner JC (1996). Reduced surface: an efficient way to compute molecular surfaces. Biopolymers, 38 (3), 305-20 PMID: 8906967
- Goodsell, D. (2002). p53 RCSB Protein Data Bank DOI: 10.2210/rcsb_pdb/mom_2002_7
say SMILES!
Recently, Babel (in my system) was not working and I needed to convert my .sdf files to smiles format. I troubleshooted the error was able to run successfully. But, this made me think, what about a web-based application to do this format conversion? That’s how I found these three amazing tools based at the National Cancer Institute’s CADD Chemoinformatics group.
1. Online SMILES Translator and Structure File Generator
http://cactus.nci.nih.gov/translate/
Upload your .sdf file and get the SMILES format in Kekule or Aromatic format. Also, converts .sdf file to .pdb, .smiles, and .mol. Although, it does not have all the file formats listed in Babel. For a quick conversion, this is amazing site.
2. Create image files without any molecular visualization tool.
http://cactus.nci.nih.gov/gifcreator/
This was a cool site. Just put a smiles format and see the many colorful images you can make with your structure. Not only that. If you wanted to know what atom number is that Carbon next to the Nitrogen, make sure to have the “Image Map Style” to “Atoms”, similarly to see the connectivity by selecting “Bonds”. Simultaneously, if the generation of an HTML image map associated with the image is desired, just copy the code below. See details here

3. Image-to-Structure file-conversion
Found a cool structure in a book and tired of drawing that on a structure editor? This is the site for you, then. Scan the page and upload the image and see the transformation happening! And click on the “Show 3D” to see the image on paper coming as a 3D structure that you could download it as a .sdf file.
http://cactus.nci.nih.gov/cgi-bin/osra/index.cgi
See the screenshot of the image to above image to the structure
References:
![]()
Weininger, D. (1988). SMILES, a chemical language and information system. 1. Introduction to methodology and encoding rules Journal of Chemical Information and Modeling, 28 (1), 31-36 DOI: 10.1021/ci00057a005
Quick and easy animated pictures of proteins
So, here is an imaginary situation. You have a deadline to achieve and have minimal internet to reach the goal. Few hours before the deadline, your PI asks if you can send him a movie of the protein of interest in PyMOL. He specifies that the movie show the protein rotating, the active site and the ligand bound with it in surface representation, ligands as ball-and-stick, etc. He has a grant review presentation tomorrow and needs it asap.
You finish the movie and realize that to make a good impression one would need a high quality movie and that is going to eat up your internet time in uploading and you may end up not achieving both (Yours and your PI’s) goals.
Ta da! That’s where you need POLYVIEW-3D.
- It is quick and easy to use
- Easy interface with no complex manuvering required.
- Best part are the animated gifs, that are easy to send via email.
- You can set an orientation using the Jmol java applet.
- You can choose either RasMol or PyMOL rendering
- From tiny images (50×50 pixels for lab webpages) to large sized pictures (1000×1000 pixels for presentations)
- PNG and TIF format for static images. Animated ones are (of course) in Gif format.
Some of the images I made using this web-server

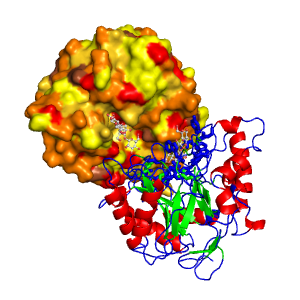
One chain in surface colored w.r.t hydrophilicity and another in Cartoon colored w.r.t secondary structure, with halo lighting

One chain in surface colored w.r.t hydrophilicity and another in Cartoon colored w.r.t secondary structure, without halo lighting

Chain A showing the active site, with ligand bound. The residues interacting with ligand are colored blue. Only one ligand, the other one is from chain B.
I think this cool, give it a try!
References:
![]() Porollo, A., & Meller, J. (2007). Versatile annotation and publication quality visualization of protein complexes using POLYVIEW-3D BMC Bioinformatics, 8 (1) DOI: 10.1186/1471-2105-8-316
Porollo, A., & Meller, J. (2007). Versatile annotation and publication quality visualization of protein complexes using POLYVIEW-3D BMC Bioinformatics, 8 (1) DOI: 10.1186/1471-2105-8-316
Protein – ligand interactions

Image courtesy: Google
Not always, but sometimes one wants to flatten the interactions between a protein and a ligand. The aim is to unclutter the three-dimensional (3D) information to a 2D image. With such visualizations, the advantages is that one gets to see the various interactions without any of them getting buried, and concentrate on the crucial ones that are the key to protein-ligand interactions. The situations where these 2D representations are used are broadly of two areas:
- Plotting the interactions of protein-ligand complexes in the existing data (from PDB database)
- Plotting the interactions between a protein and a potential drug/small molecule from a molecular docking result. Again, the input could be from a single small molecule docking or from a virtual screening.
In this post, we will see three tools that help us in achieving the goal of plotting protein-ligand interactions. ![]()
LIGPLOT – For many years, Ligplot (1) has been the choice for plotting 2D interactions. Infact, the database pdbsum makes ligplot images for a given protein-ligand interactions. The main two things shown are the hydrogen bonds and hydrophobic interactions.
Hydrogen bonds are indicated by dashed lines between the atoms involved, while hydrophobic contacts are represented by an arc with spokes radiating towards the ligand atoms they contact. The contacted atoms are shown with spokes radiating back.

LIGPLOT
PoseView – This is a new tool that came out two years ago (2). It has Ligplot-like image generation but it has more features than Ligplot.
The 2D depiction shows hydrogen bonds as dashed lines between the interaction partners on either side. Hydrophobic interactions are illustrated as smooth contour lines between the respective amino acids and the ligand.
Recently PDB database incroporated poseview with the structures that are present. So, one can get the 2D plots straight away from PDB itself in the Ligand section of each protein, for example here. The web-interface for PoseView can be accessed here.

PoseView
BINding ANAlyzer (BINANA) – This is probably the most recent protein-ligand representation tool (3). Although, not exactly a 2D plotting tool, it has more features than Ligplot or PoseView, namely it can plot electrostatic interactions, pi pi stacking, cation-pi interactions, and more. The only downside is that it needs the input in .PDBQT format. This can be obtained via AutoDock Tools. The output can be visualized via VMD, thus making the 2D back into 3D bu with distinguishable features.

BINANA
References:
1. Wallace AC, Laskowski RA, & Thornton JM (1995). LIGPLOT: a program to generate schematic diagrams of protein-ligand interactions. Protein engineering, 8 (2), 127-34 PMID: 7630882
2. Stierand, K., & Rarey, M. (2010). Drawing the PDB: Protein−Ligand Complexes in Two Dimensions ACS Medicinal Chemistry Letters, 1 (9), 540-545 DOI: 10.1021/ml100164p
3. Durrant, J., & McCammon, J. (2011). BINANA: A novel algorithm for ligand-binding characterization Journal of Molecular Graphics and Modelling, 29 (6), 888-893 DOI: 10.1016/j.jmgm.2011.01.004


