What would be like to teach a class or describe someone about a protein, without visualizing its structure? Boring is one word that pops in my mind. I vividly remember the professor drawing two blobs touching each other, to describe protein-protein interaction, while explaining it either on the blackboard or on the transparencies of a over-head projector. Those were the days! Tracing back nearly 60 years back, when John Kendrew showed everyone a coiled mess, it has fueled every scientist’s imagination to visualize a protein. The coiled mess is aptly titled “Turd of the century”!

Image Courtesy: Stephen Curry, Flickr.
Image reproduced under Creative Common Licence
If you are in UK, Click here to see the exhibit of myoglobin, and the accompanying Guardian article. If John Kendrew had the plethora of visualization choices like we have today, what could have happened?
Coming to today, it is become so routine to use a molecular visualization tool to check-out a protein. And most journals contain the Jmol plugin while browsing the full text of any article, if they discuss any structures from the PDB. So, when a survey was recently conducted by Craig P. A. et al to estimate the effectiveness of these tools, certain things were obvious.
- Molecular visualization software/tools is akin to Oxygen for researchers and most importantly, for educators.
- They make it fun to understand the complex biology behind every structure
It makes sense to survey only about freeware since
neither student nor faculty are usually willing (or able) to pay for commercial molecular visualization software when freeware applications are available
 10 years ago, I used to use Chime very frequently and now Jmol has replaced it as the web plugin. (Whatever happened to Chime?) The majority of people who participated in the survey were associate professors, using Windows and have been using the various tools for the past 5-10 years. The biggest use was for teaching biochemistry classes. It is no surprise that PyMOL came across as the most frequently used software. However, the supported version being commercially sold by Schrodinger, many participants from small undergrad institutions have voiced their dissatisfaction about it. Since, the educational version is a pain.
The survey posted some interesting open-ended questions:
- What additional resources would you like to have available to teach molecular structures?
- What would you like to be able to do with 3D molecular visualization programs that you currently cannot do?
For the second, question many wanted “a simple way to create animations/morphs between structures”. The authors noted that while there are resources available inherently with the tool the participants were using. There was a clear lack of awareness of the full-potential of the software they were using. Readers of this blog would remember the previous post of making animated gifs of proteins (Yes, it is pronounced as Jif!). Also, the Yale Morph Server does a good job of showing conformational change in a protein.
To tackle this issue, some universities have a one-semester course for graduate students and postdocs, where they teach how to use visualization tools and also how to best present a molecular structures. But, for others who don’t have such courses scroll down to the end to see some practical solutions.
How does the future look like?
From the survey, it looked like four areas needed more concentration
- Assessment – How to know exactly if the student understood the background of the protein? In other words, some type of rubric to follow. Rubrics might be easier for assessing undergrad classes in an uniform way, but make it complex for assessing the graduate student who is working on a narrow-down topic
- Support – Need for tutorials for users at different levels
- Attitude – That is there exists a kind of wall between the student and the computer.
- Software – Can ONE software do everything that VMD, Chimera, and PyMOL put together? I really like that idea!
Among the wishlist the participants asked was to have the tool efficiently demonstrate dynamics, motions, protein-ligand interactions. To some extent, depending on which tool one is using, these are implemented as plugins or modules. This brings us back to the topic of creating awareness about the tool in use.
How to create your own custom tutorial to learn a new molecular visualization tool?
So, you have come across a new freeware, mentioned by your colleague or read somewhere, and want to use it. Some tips that would be useful are as follows:
- If you don’t have permissions to install, of course you need to get your administrator to install it. There is always the alternative of installing it in your laptop. If you are really apprehensive about the tool, create a guest account (with no administrative permissions) and install it in the desktop area.
- Almost all tools come with tutorials as to how to take the baby-steps of learning the tool. If you don’t like it, download a PDB file from this link. It has PDB entries with “Only Protein with Ligand”
- As a kid if you have broken down a new toy to its nuts and bolts and recreated it back to factory settings, then this step is easier. Basically, try every option one after another. This might take time and can be somewhat frustrating. But, there are “Aah” moments while doing it and the time invested now is greatly rewarding when you have to figure out with your protein of interest.
- Google “The tool in use” and search in images, you will see a plethora of images made by others which can be taken as a small assignment to take up. Don’t worry about completing it to the end. The objective is to getting to know the software/tool rather than getting good results
- If you like the tool, try recreating something interesting that you had done with another tool. Compare and contrast. Now, you know something that others don’t!
References:
- Craig, P., Michel, L., & Bateman, R. (2013). A survey of educational uses of molecular visualization freeware Biochemistry and Molecular Biology Education, 41 (3), 193-205 DOI: 10.1002/bmb.20693
- http://www.guardian.co.uk/science/occams-corner/2013/apr/19/1
- http://www.sciencemuseum.org.uk/visitmuseum/galleries/crystallography.aspx
- http://molmovdb.mbb.yale.edu/molmovdb/morph/

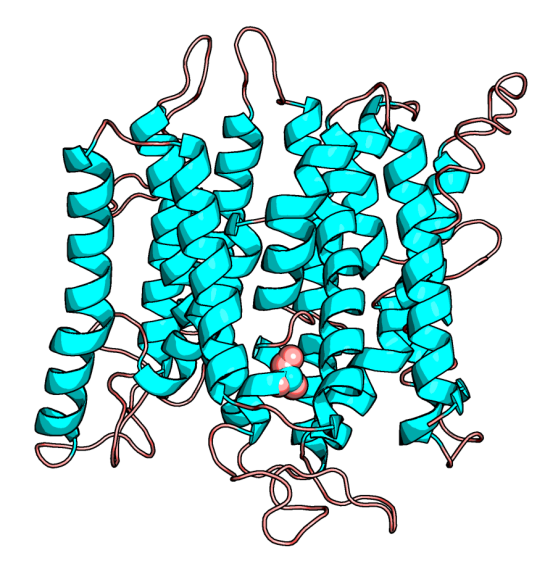
![]() The gene in limelight is SLC45A2, which is present in many vertebrates including Humans. (Uniprot id: Q9UMX9) In humans this “pigmentation related gene in humans, whose polymorphisms are associated with light skin color in modern Europeans and pathogenic mutations known to cause oculocutaneous albinism type 4“. From a structural bioinformatics perspective, the paper provides as to how this mutation can be understood towards its function in the mutant. It is a membrane protein and the solved structure is not available, but the homology modeled structure is available in ModBase [2]. See below the modeled protein structure from ModBase, with the position 477 highlighted. Figure 3 of the paper shows a different way of showing the multiple sequence alignment.
The gene in limelight is SLC45A2, which is present in many vertebrates including Humans. (Uniprot id: Q9UMX9) In humans this “pigmentation related gene in humans, whose polymorphisms are associated with light skin color in modern Europeans and pathogenic mutations known to cause oculocutaneous albinism type 4“. From a structural bioinformatics perspective, the paper provides as to how this mutation can be understood towards its function in the mutant. It is a membrane protein and the solved structure is not available, but the homology modeled structure is available in ModBase [2]. See below the modeled protein structure from ModBase, with the position 477 highlighted. Figure 3 of the paper shows a different way of showing the multiple sequence alignment.


